

Mobile Logo

Competitor Delivery Radius Analysis for
Food Delivery Leaders
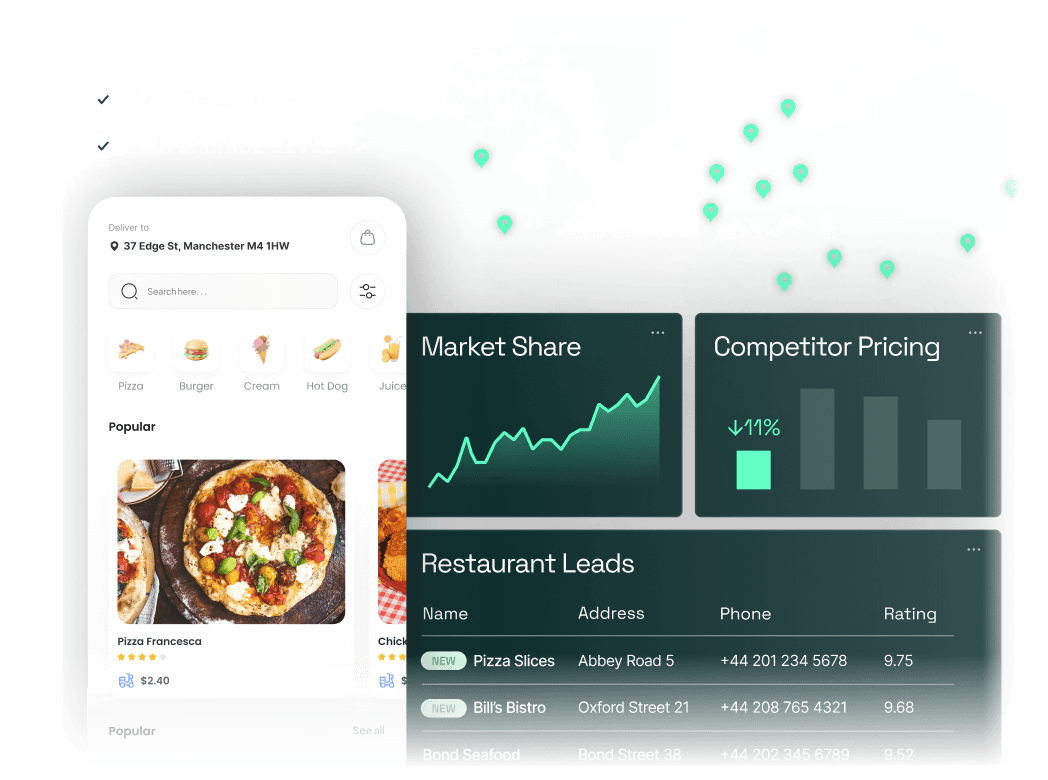
Competitor Delivery Radius Analysis reveals exactly where rival platforms service restaurants across specific city zones. Strategy teams map these coverage boundaries to spot expansion opportunities and launch into untapped neighborhoods before competitors react.

Trusted by Fortune 500.

Get real-time data from all food platforms.

Without this data

Your team relies on guesswork to define operational limits

Operating without precise coverage boundaries leaves expansion strategy incomplete. Growth teams push into oversaturated zones while ignoring highly profitable neighborhoods where rivals lack supply.

Strategic
Expansion targets rely on assumptions
Market planners build annual launch roadmaps without knowing exact competitor territory lines. Millions are allocated to penetrate areas already locked down by heavily subsidized rivals.
Operational
Analysts scrape postal codes manually
Operations teams waste dozens of hours every week entering random addresses to check restaurant availability. This manual verification yields fragmented datasets that become outdated within days.
Business
Market share bleeds in border zones
Suboptimal radius configurations leave thousands of hungry customers just outside your serviceable area. Competitors absorb these high-intent buyers and establish long-term ordering habits.
Intelligence
Leadership reacts to quarterly reports
Executives only discover competitor footprint changes when trailing GMV reports show unexpected dips. Board-level territory decisions happen months after rivals have already secured the local restaurant base.
Sample signal

What a delivery radius record looks like

This structured data maps the exact geographical boundaries of a restaurant listing on a competing platform. Strategy teams use these coordinates to visualize market density and find immediate coverage gaps.

Venue Name Platform Coordinates (LAT, LNG) Service Radius Zone Status Density Score Last Detected
Wagamama Deliveroo 51.5132, -0.1264 3.8 km New Boundary 4.8 / 5 today 10:45
Nando's Uber Eats 51.4627, -0.1158 4.2 km Established 4.1 / 5 yesterday
Sweetgreen DoorDash 40.7580, -73.9855 2.5 mi Restricted 3.6 / 5 today 08:20
Five Guys Glovo 41.3851, 2.1734 5.0 km Expanding 4.9 / 5 2 days ago
KFC Just Eat 52.4862, -1.8904 3.1 km New Boundary 4.5 / 5 today 14:10
What you get

Your team maps the total addressable market

FoodDataLab delivers precise geographical intelligence straight into your analytics stack. Operations and strategy units get a continuously refreshed view of exactly where competitors operate.

45+ platforms
Channels tracked
Monitor coverage maps across global apps.
<24h latency
Update frequency
Receive daily coordinate and radius updates.
12+ metadata
Fields enriched
Access exact polygon and boundary limits.
100K+ polygons
Zones processed
Track neighborhood boundaries at vast scale.

What food delivery providers want to understand with data

0:00
Double Data Logo

FoodDataLab use cases across food delivery departments

0:00
Double Data Logo

Why in-house food delivery data scraping costs more than you think

0:00
Double Data Logo

How our data serves pricing and marketing teams worldwide

0:00
Double Data Logo

Why comparing food delivery platform pricing is so hard?

0:00
Double Data Logo
Business impact

Turn geographical intelligence into market share

Precise territorial data dictates who wins hyper-local food delivery battles. Deploy your fleet where competitors cannot reach.

Capture untapped zones
Identify dense neighborhoods where rivals restrict their delivery range. Launch targeted acquisition campaigns to win these orphaned customers immediately.
Optimize courier fleets
Realign your active operational boundaries based on confirmed competitor weaknesses. Protect service levels while maintaining maximum geographical dominance.
Outpace rival expansion
Detect new city launches and zone extensions the moment they go live publicly. Counter their moves by aggressively expanding your own territory borders.
How it works

From raw geographical signals to actionable mapping

Our data pipeline captures public territory data and formats it for immediate spatial analysis. Operations teams integrate this intelligence directly into their existing mapping tools.

1

Extract

We scan food delivery platforms like Glovo, DoorDash, and Uber Eats to extract publicly visible service areas. This captures the true geographical footprint of every listed venue.
2

Normalize

Raw location signals are translated into clean spatial data formats suitable for mapping. Venue boundaries are matched and reconciled against Google Maps coordinates.
3

Deliver

Clean spatial records flow directly into Tableau, Power BI, or your proprietary data lakes via REST API. Strategy teams instantly visualize these boundaries without building custom pipelines.
FAQ

Questions we get from strategy leaders like you

Straight answers about coverage methodology, data freshness, and analytical integration.

Start mapping your competitor boundaries

Request a sample dataset covering a specific city and competitor of your choice. Our analysts will provide a tailored export so you can evaluate the spatial accuracy firsthand.

  • A dedicated data expert assigned to your case
  • No obligation, free consultation
  • Full support from scoping to delivery

Need an NDA first? Just mention it in the form - we're happy to sign.

Logo

Get access to the only

market intelligence you need

© 2026 doubledata.com | All Rights Reserved

Made by mush studio