


Market Saturation & Churn Metrics for
Food Delivery Leaders
Trusted by Fortune 500.
Get real-time data from all food platforms.
Your team wastes resources on inefficient market expansion
Missing venue tracking data means sales teams deploy blindly into heavily saturated zones. Account management fails to notice when key restaurant partners drop off competing apps.

What a market saturation record looks like
Each record provides a normalized view of a restaurant's availability across multiple apps alongside its operational status. Teams use this immediately to identify exclusive partnerships or recent platform exits.
| Venue Entity | Entity ID | Active Platforms | Agg. Rating | Network Signal | Last Verified |
|---|---|---|---|---|---|
| Dishoom Shoreditch | LND-8821A | Deliveroo, Just Eat | 4.8 / 5 | Platform Exit | today 08:14 |
| Sweetgreen | NYC-3944B | Uber Eats, DoorDash | 4.6 / 5 | Saturated | today 11:22 |
| Pizzana | LAX-1190C | Postmates Only | 4.9 / 5 | Exclusive | yesterday |
| Honest Burgers | LND-2284D | Uber Eats | 4.3 / 5 | Expansion Gap | 2 days ago |
| Chipotle Mexican Grill | CHI-9921E | Grubhub, DoorDash | 3.9 / 5 | Platform Drop | today 09:45 |
Your team gains precise visibility into network scale
FoodDataLab delivers structured market intelligence right into your existing business intelligence stack. Account managers track exact platform penetration rates to uncover where competitors are overextended.
What food delivery providers want to understand with data

FoodDataLab use cases across food delivery departments
Why in-house food delivery data scraping costs more than you think
How our data serves pricing and marketing teams worldwide
Why comparing food delivery platform pricing is so hard?
Turn venue turnover into actionable growth opportunities
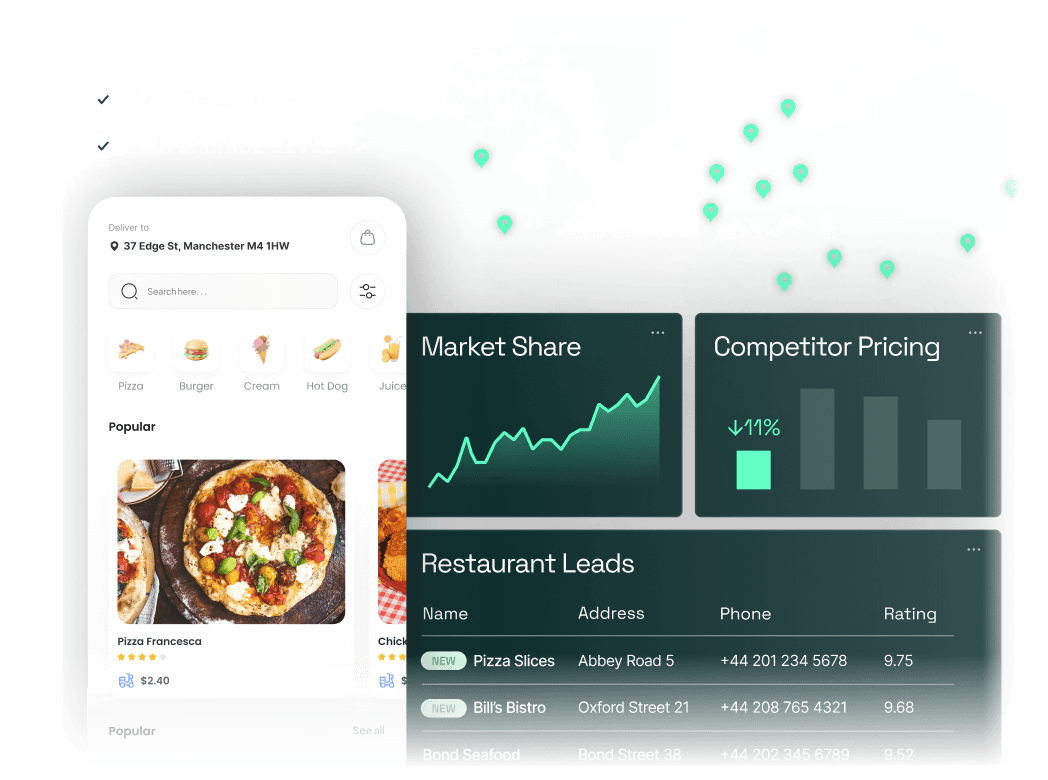
Precise tracking of network scale translates directly into market share gains. Sales teams stop prospecting blindly and start targeting highly qualified restaurant leads.
From scattered listings to total market clarity in 3 steps
We structure messy geographic and restaurant data into a normalized pipeline. Your strategic planners receive clean metrics ready for immediate analysis.
Extract
Normalize
Deliver
Questions we get from food delivery executives
Straight answers about how we map network scale and track venue turnover.
Start tracking your total addressable market today
Request a sample dataset covering market saturation and churn metrics for your specific operating cities. Our intelligence analysts will provide a tailored view of competitor coverage with zero long term commitment.
- A dedicated data expert assigned to your case
- No obligation, free consultation
- Full support from scoping to delivery
Need an NDA first? Just mention it in the form - we're happy to sign.