

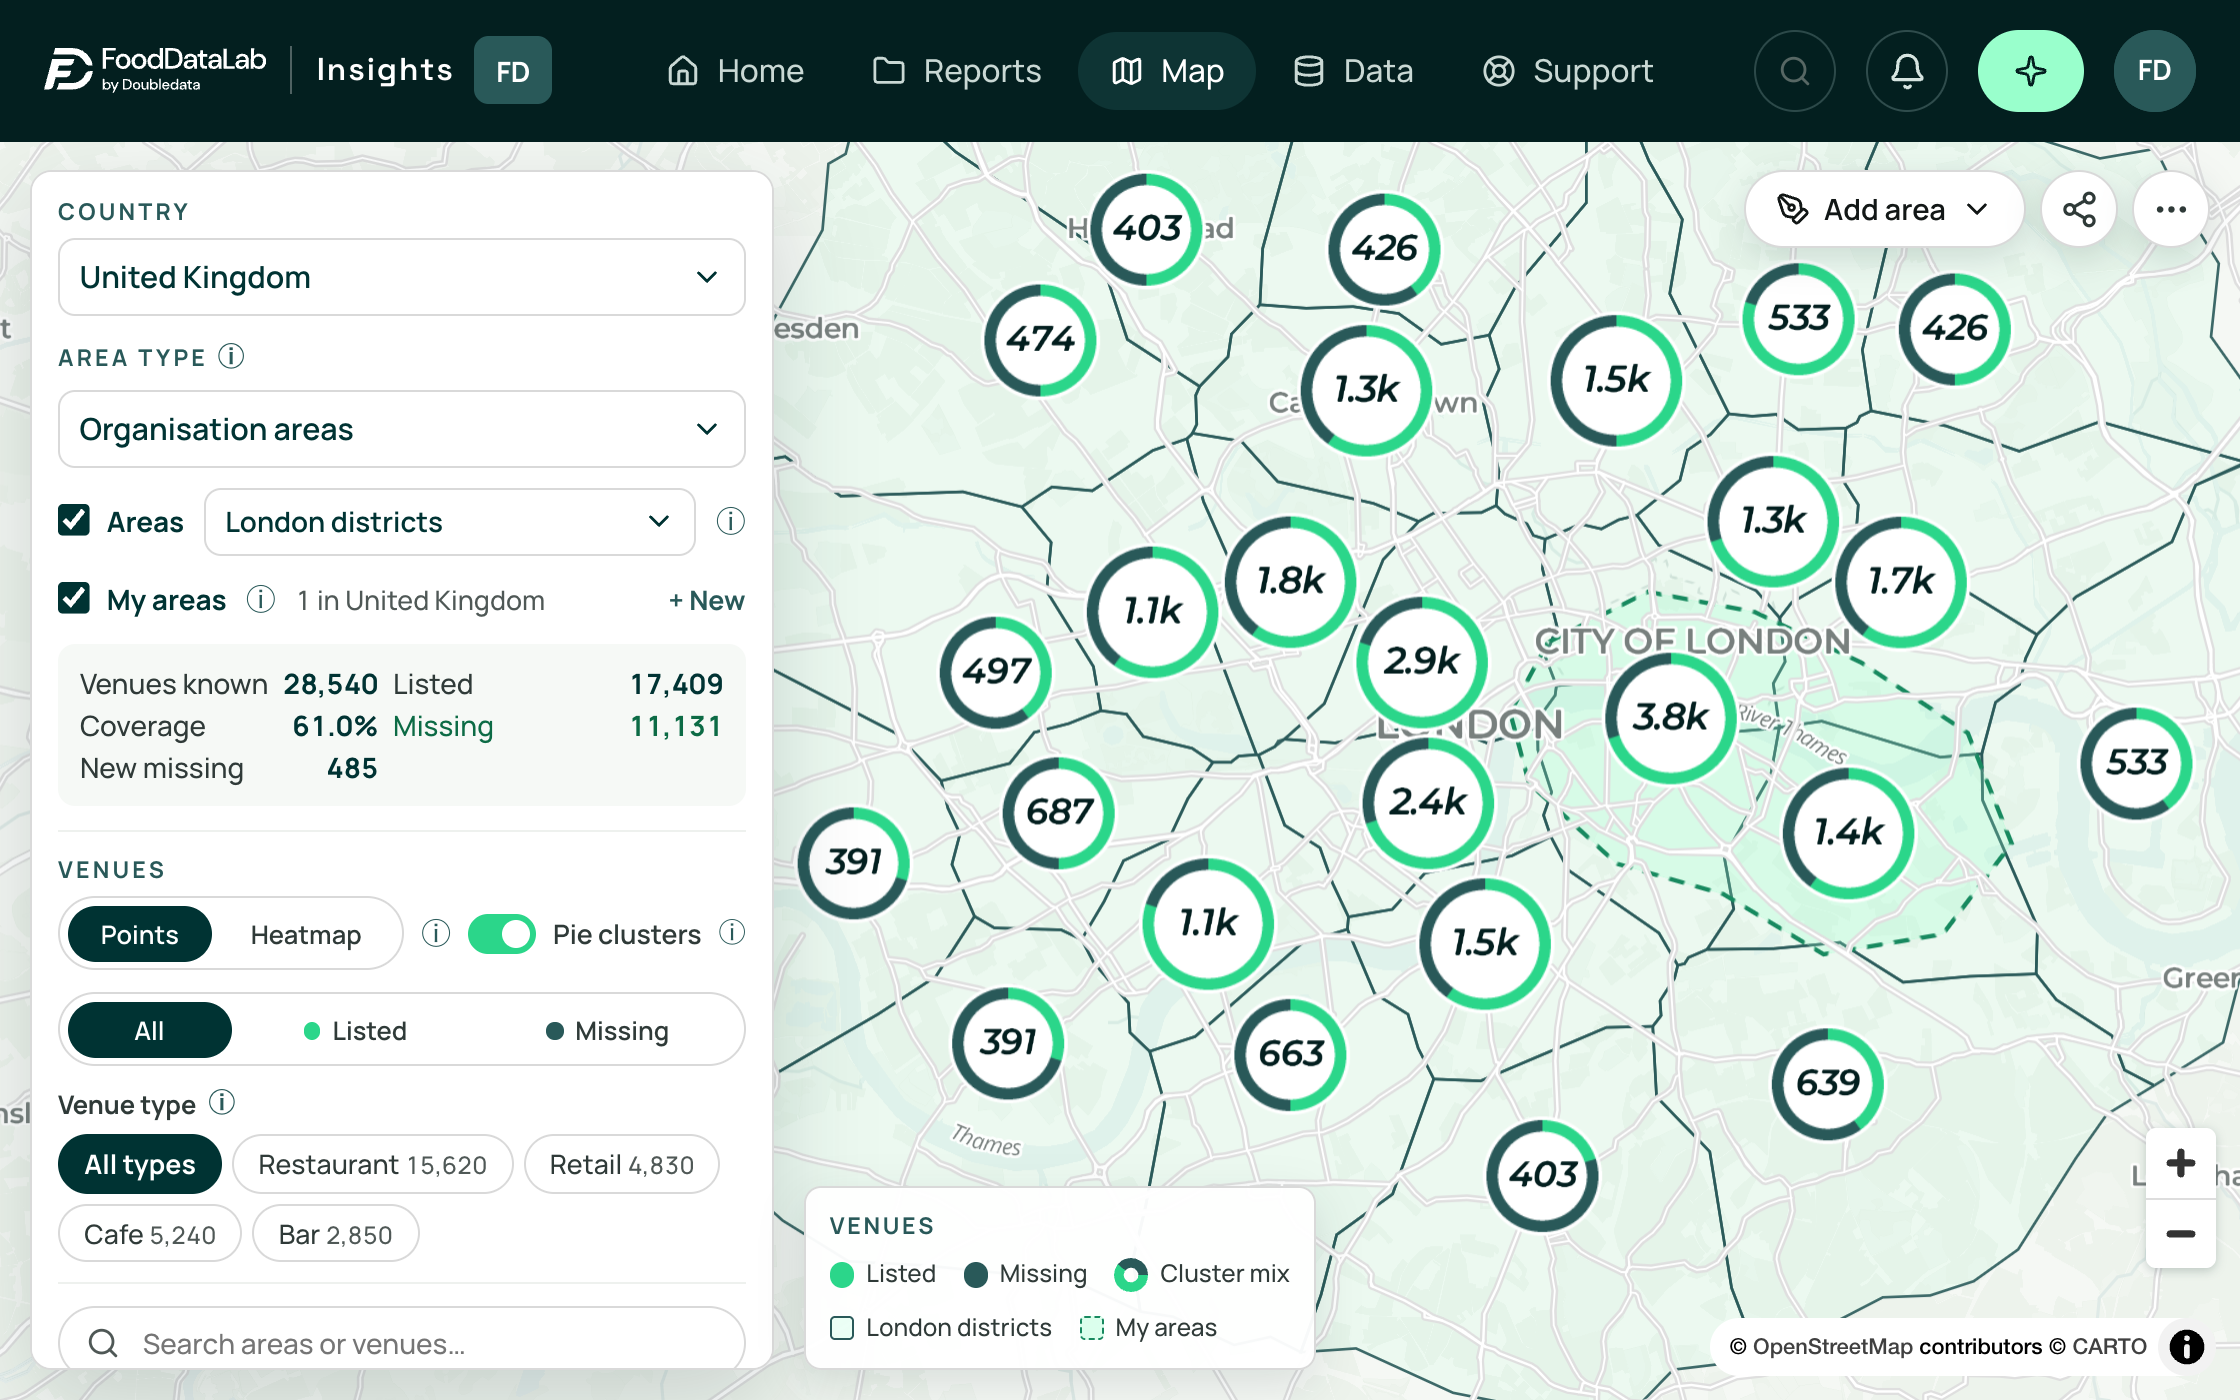
Illustration: a coverage dashboard with invented London figures. A district map shows six clusters split into listed and missing venues and a dashed custom territory, beside totals of 28,540 venues known, 17,409 listed, 11,131 missing and 61.0% coverage, with 485 newly missing.
From coverage map to scheduled report
Screens show fictional venues and figures.
Listed and missing venues on one map
Each venue appears on the map as listed or unlisted on your platform, and each area carries its coverage percentage.
1 of 4
Screens show fictional venues and figures.
The venues your app does not list yet
Switch the map to missing venues and open one to see its address, rating, and the apps it already sells on.
1 of 4
Screens show fictional venues and figures.
A report for each area
Open an area to see its figures and the top unsigned venues in it.
1 of 4
Screens show fictional venues and figures.
A lead list your team can call
A recurring report lists the venues that recently joined each platform.
1 of 4
Screens show fictional venues and figures.
Questions answered from your data
Type a question about your own data in everyday English and get the answer without writing SQL.
1 of 4
Uses across sales, expansion, and leadership
Sales
Call list, London
- Fennel & Fig Bistro
- +44 20 7946 0128
- The Sorrel Table
- +44 20 7946 0135
- Kestrel Corner Café
- +44 20 7946 0151
Expansion
Compare coverage between cities before you pick the next one to launch in.
- Berlin72.4%
- Munich70.2%
- Hamburg69.5%
- Prague68.1%
- Vienna66.8%
- Milan63.5%
- Bratislava61.8%
- London61.0%
- Lisbon57.6%
- Zagreb55.0%
- Budapest54.2%
- Athens51.3%
- Sofia49.6%
- Bucharest47.9%
- Belgrade46.2%
- Thessaloniki44.8%
Leadership
Scheduled report
- Report
- London coverage
- Sends
- Mondays at 8:00
- Format
- PDF and XLSX
485
+26 since October
New missing venues, London
Venues first seen on competitor apps and not yet on yours.
- Dec: 267
- Jan: 237
- Feb: 259
- Mar: 307
- Apr: 292
- May: 337
- Jun: 355
- Jul: 385
- Aug: 367
- Sep: 433
- Oct: 459
- Nov: 485
Report formats
Ways to share
- Download
- CSV, XLSX, PDF, PNG
- On your schedule
- Content
- The filtered view
10M+
Venues tracked
Venues known in a market come from delivery apps and Google Maps.
200+
Markets to compare
Answers without SQL
Managers put coverage questions to the AI Analyst in plain words and read a table back.
What new users raise first

Pick a market for your walkthrough
Name a city or country and the platform you work for. The walkthrough uses real venue data from that market.
- A live session with a FoodDataLab analyst
- Your own city and platform as the example
- Answers on setup and access